The interval and tender offer fund market is growing fast. And funds that are easy to access and trade are proving popular.
By Kimberly Flynn, CFA
President, XA Investments
July 30, 2025
In the evergreen product market for private wealth, the daily NAV interval fund with no suitability restrictions is king. Why? Daily NAV means electronic ticketing for interval funds and ease of use for financial advisors.
The non-listed CEF market reached a new peak with 288 interval and tender offer funds with a total of $196 billion in net assets and $227 billion in total managed assets, inclusive of leverage, as of June 30, 2025. The market includes 144 interval funds representing $133bn or 59% of market wide total managed assets and 144 tender offer funds representing $94bn or the remaining 41%. Interval funds have increased in popularity and are better understood in the marketplace because the rules around interval fund liquidity frequency and redemption percentages for shareholders are determined at the time of fund launch. Tender offer funds have more flexible rules and potential variability in liquidity (which can complicate onboarding at broker-dealer firms who must process tenders manually).
In the marketplace today, there are 128 daily NAV interval funds representing 44% of funds and 51% of assets. Financial advisor preferences for electronic ticketing have accelerated the growth of such easy to purchase interval funds. The number of interval funds has increased 52% since 12/31/23, compared to 24% for tender offer funds over the same period. This has resulted in the interval fund structure catching up with tender offer fund counts – both at 144 as of quarter end.
To make alternative investments more accessible, an increasing number of fund sponsors are designing products in a customer-friendly structure with limited or no suitability restrictions at all. The majority of interval and tender offer funds (53%) do not have any suitability restrictions for investors imposed at the fund level — 27% of funds are available to accredited investors and 20% are only available to qualified clients.
The amount of funds offered with no suitability restrictions is also predicted to increase with a recent change in the position of SEC Staff on limitations in fund investments in underlying private funds. Following this change, 15+ interval and tender offer funds have filed prospectus supplements removing accredited investor requirements to open the fund up to a wider audience of investor dollars. The XA Investments research team expects more interval funds to remove or reduce their suitability requirements soon. Interval and tender offer funds without suitability restrictions have gathered 57% of market-wide assets.
Capital raising success for interval funds is driven by convenience for financial advisors who are active interval fund users. In Q1 2025, interval and tender offer funds had positive net flows, totaling over $13.7 billion, with 67% of funds reporting positive net flows. The majority of net flows in Q1 2025 went into daily NAV funds, attracting 62% of market wide net flows. See the chart below which breaks down the latest net flow information in the interval fund market by NAV frequency.
Chart 1: Interval Fund Net Flows by Valuation Frequency

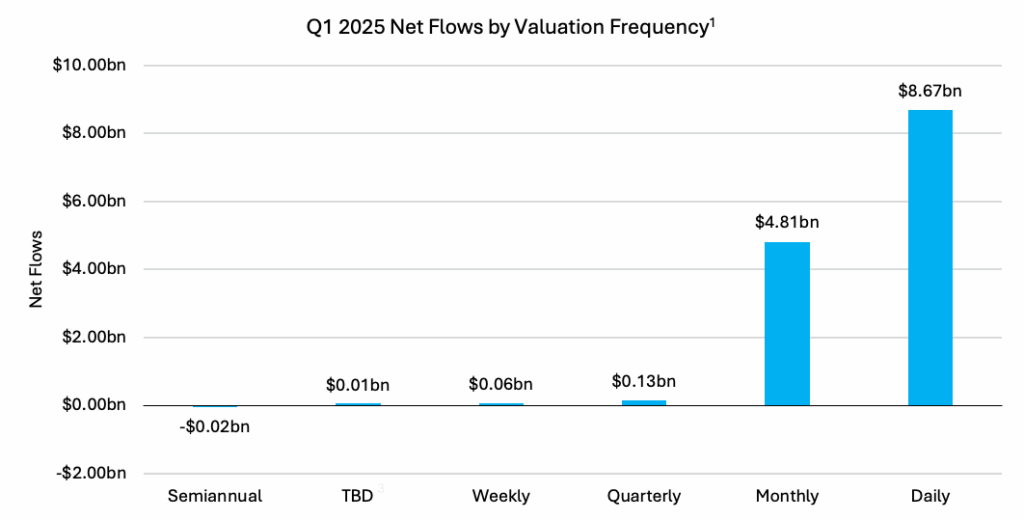
Two-thirds (67%) of market wide net flows went into interval/tender offer funds with no suitability restrictions, while 12% went into funds limited in sale to accredited investors, and 21% went into funds limited in sale to qualified clients. As an aside, those interval and tender offer funds that are limited in sale to qualified clients typically have performance fees that are in line with fees charged on other institutional pools of capital. XA Investments observes a contra-trend here with an increase in the number of funds charging performance fees as the institutional pedigree of select new fund entrants increases.
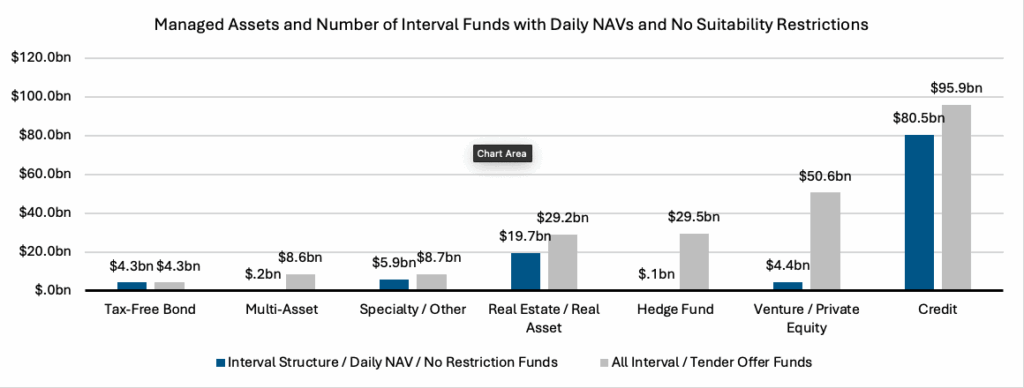
Private credit remains the largest category of the interval and tender offer fund market with 96 total funds and $96bn in managed assets representing 42% of the market. Private credit funds brought in $7.19 billion in net flows which is 53% of the total market net flows ($13.66bn) in Q1 2025. In the chart below, you can see the dominance of the daily NAV private credit fund with no suitability restrictions as compared with other asset classes.
Chart 2: Private Credit Interval Funds with Daily NAV and No Restrictions Dominate Market
The interval and tender offer fund market continues to show record asset growth with 50 funds reaching over $1 billion in assets under management and seven of those funds hitting the $1 billion milestone this quarter. With the necessary proof-of-concept, it is no surprise that we have observed new fund sponsors entering the market and an increased pace of new fund SEC filings. In Q2 2025, 23 new funds entered the market, representing an increase of 13 funds compared to the 10 funds launched in the same period last year. Among the new funds launched in Q2 2025, there were nine new interval fund sponsors, including Corient, Coatue, and Select Equity Group, among others. So far in 2025, there have been 46 new SEC filings, compared to 27 new filings from this point in 2024, representing a 70% increase in registrations.
Kimberly Flynn, CFA is President of XA Investments, a Chicago-based firm that provides investment fund structuring and consulting services focused on registered closed-end funds, among other things. XA Investments recently launched the XAI Interval Fund IndexTM (INTVL), a total return index that tracks the interval fund market, helping to address the lack of easily accessible information on the interval fund market. The firm publishes daily interval fund market observations on LinkedIn and produces an in-depth quarterly report on that market, which can be found at www.xainvestments.com
Sources: XA Investments; CEFData.com; SEC Filings.
Notes: All information as of 6/30/2025 unless otherwise noted. The non-listed CEF market is subject to lags in reporting and limited data availability. Data such as asset levels, net flows, and performance are delayed up to 90 days after quarter-end and are not available for all funds. All data in the report is the most current available. Please contact our team if you have any questions about the non-listed CEF marketplace.